Top 20 congressional stock returns: what a 2025 estimate shows—and what it cannot prove
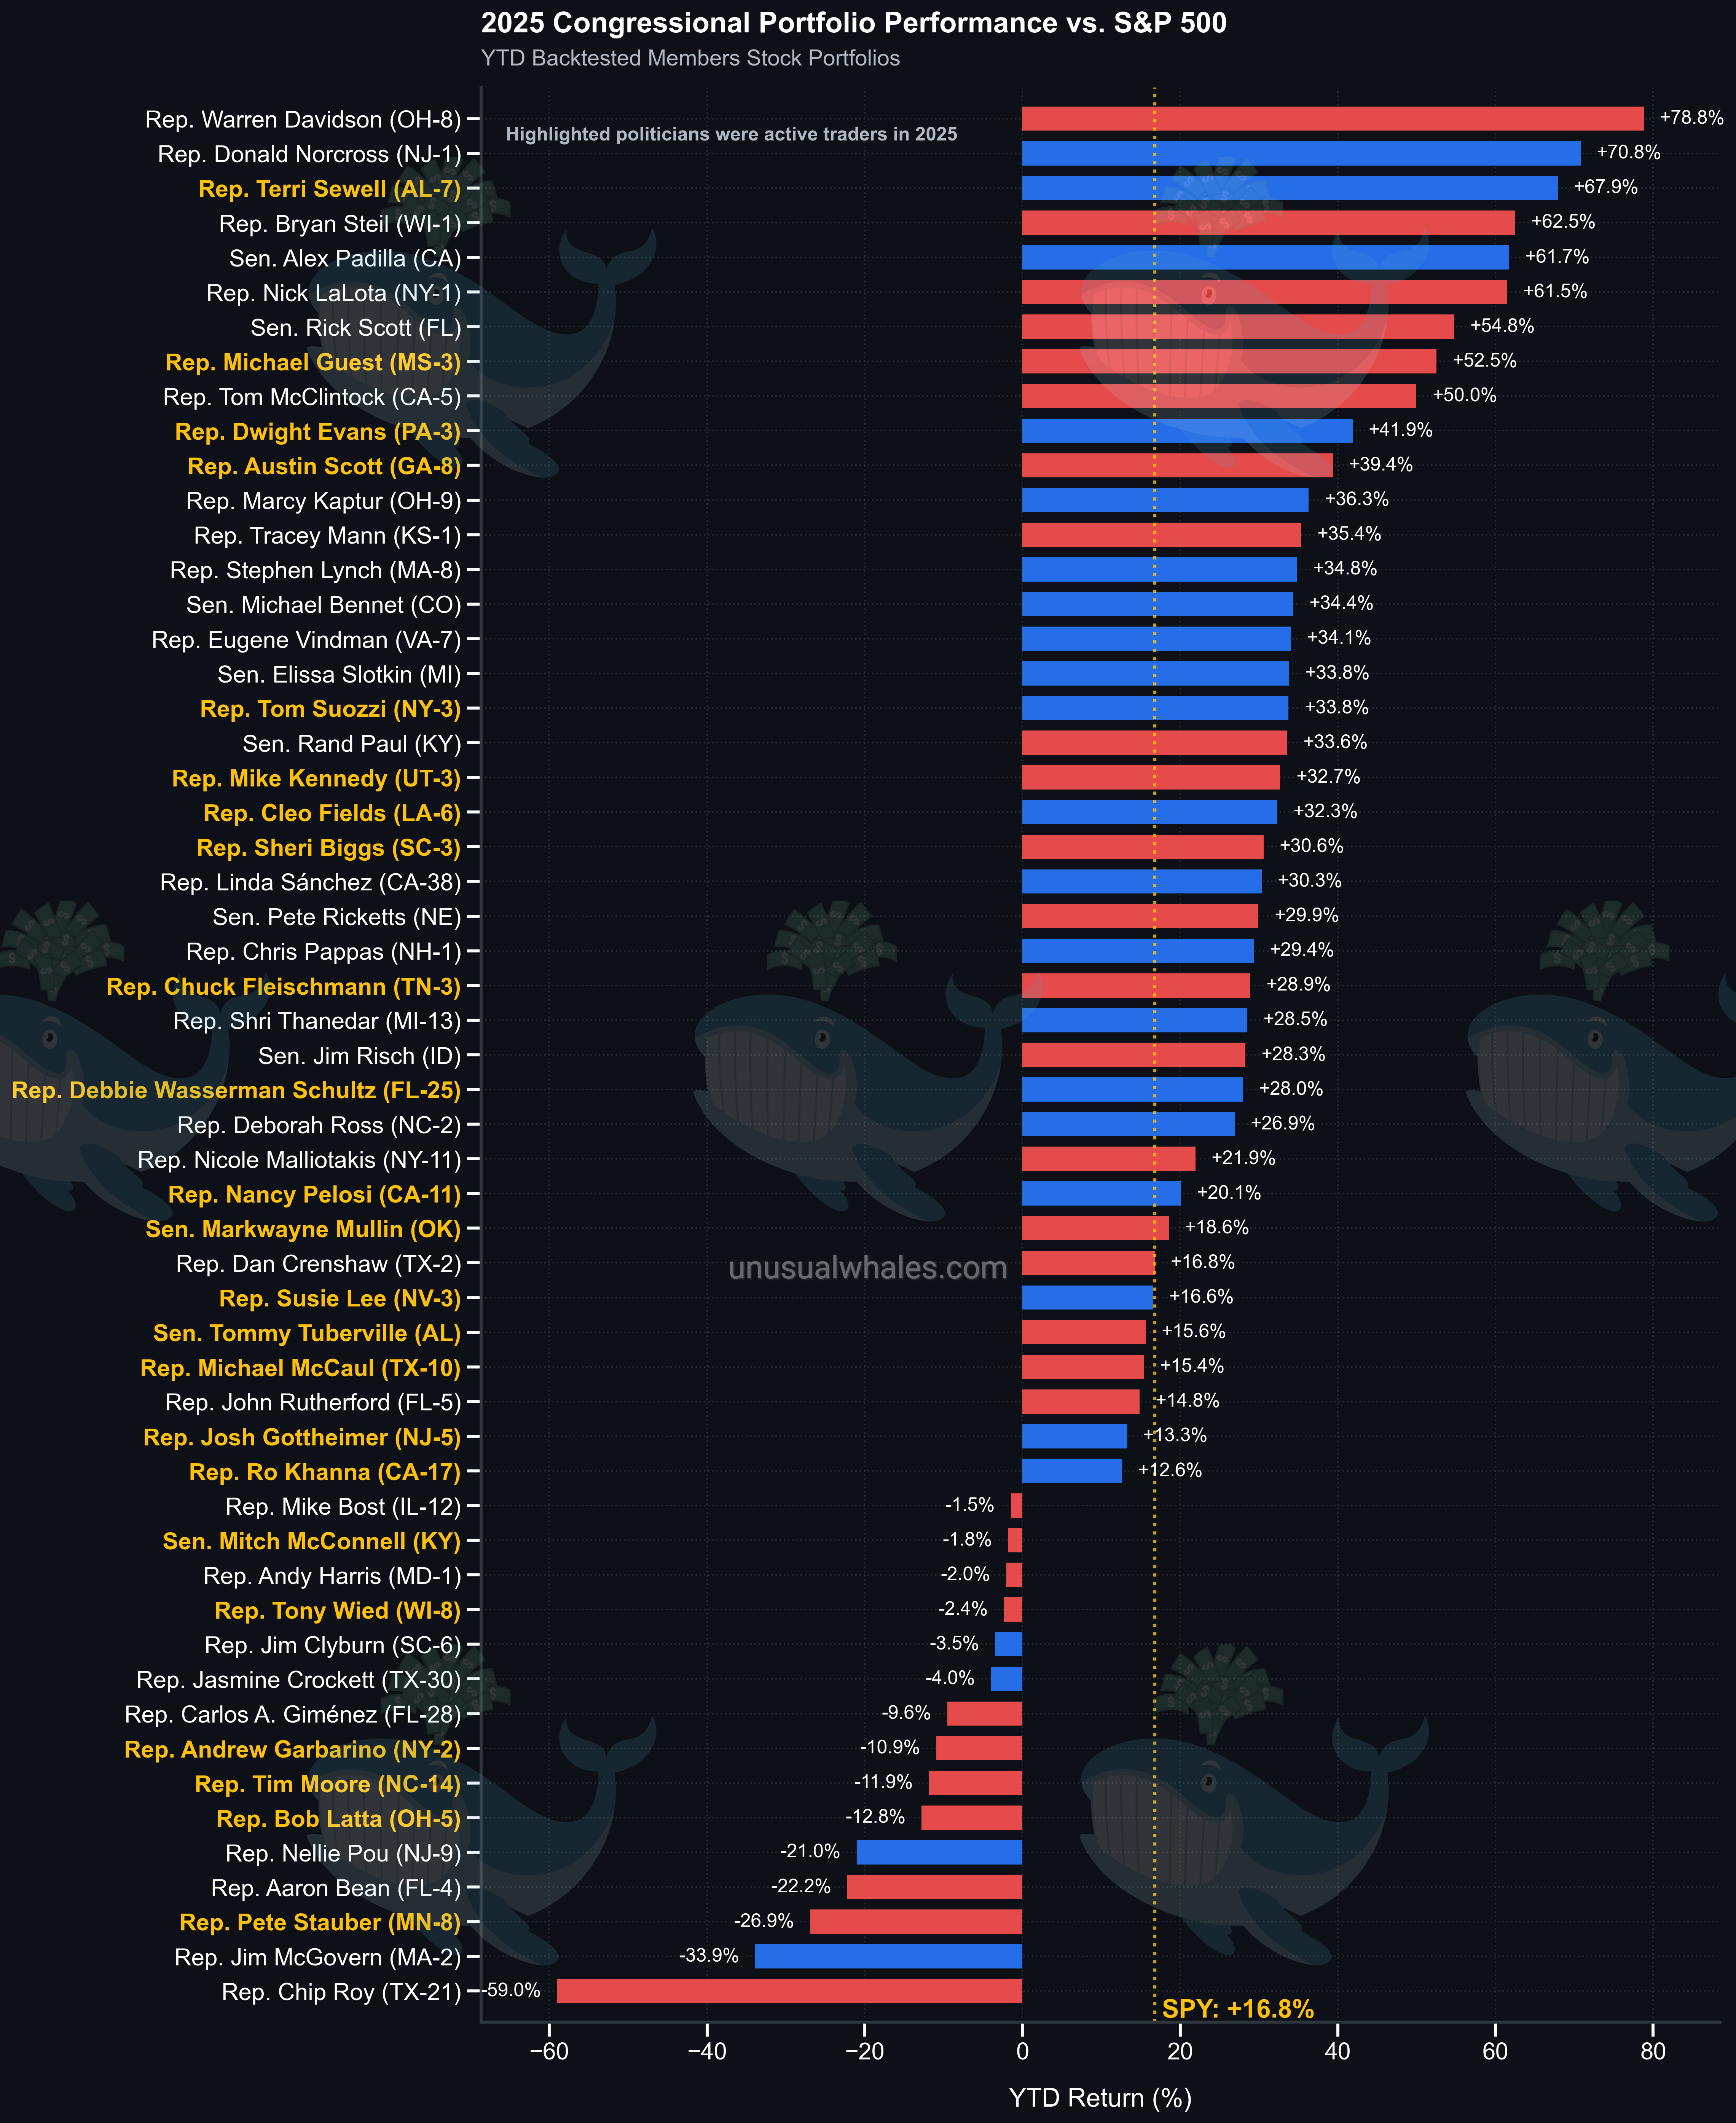
Davidson leads Unusual Whales’ published chart. These are modeled percentage returns, with a December 29 cutoff, rather than audited dollar profits.

Warren Davidson$ leads the published Unusual Whales ranking of estimated congressional investment returns for 2025, followed by Donald Norcross$ and Terri Sewell$. The figures describe reconstructed portfolios. They do not establish how many dollars each person earned, and they are not findings of insider trading.
Below are the first 20 names in the report’s active-member performance chart. The ranking is an attributed source snapshot, not an independently audited league table of every member of Congress. It uses disclosures available through December 29, 2025. That cutoff means it should not be mistaken for a complete, final accounting of all trades or all calendar-year gains.
The distinction matters because “highest return” and “most money made” answer different questions. A large percentage gain on a small account can produce fewer dollars than a modest gain on a much larger account.
The top 20, as reported#
The percentages below were transcribed from the original Unusual Whales chart. They preserve its displayed precision. The table includes House and Senate members; party and state identify the members, not a party-wide investment result. Identities were checked against the House Clerk’s member list and the Senate directory.
| Rank. | Member. | Party–state. | Estimated return. |
|---|---|---|---|
| 1. | Warren Davidson. | R–OH. | 78.8%. |
| 2. | Donald Norcross. | D–NJ. | 70.8%. |
| 3. | Terri Sewell. | D–AL. | 67.9%. |
| 4. | Bryan Steil$. | R–WI. | 62.5%. |
| 5. | Alex Padilla$. | D–CA. | 61.7%. |
| 6. | Nick LaLota$. | R–NY. | 61.5%. |
| 7. | Rick Scott$. | R–FL. | 54.8%. |
| 8. | Michael Guest$. | R–MS. | 52.5%. |
| 9. | Tom McClintock$*. | R–CA. | 50.0%. |
| 10. | Dwight Evans$. | D–PA. | 41.9%. |
| 11. | Austin Scott$. | R–GA. | 39.4%. |
| 12. | Marcy Kaptur$. | D–OH. | 36.3%. |
| 13. | Tracey Mann$. | R–KS. | 35.4%. |
| 14. | Stephen Lynch$. | D–MA. | 34.8%. |
| 15. | Michael Bennet$. | D–CO. | 34.4%. |
| 16. | Eugene Vindman$. | D–VA. | 34.1%. |
| 17=. | Elissa Slotkin$. | D–MI. | 33.8%. |
| 17=. | Tom Suozzi$. | D–NY. | 33.8%. |
| 19. | Rand Paul$. | R–KY. | 33.6%. |
| 20. | Mike Kennedy. | R–UT. | 32.7%. |
Slotkin and Suozzi are tied at the chart’s displayed precision. Their order does not establish that one performed better. Rounding to one decimal place can conceal smaller differences.
Source discrepancy: McClintock appears at 50.0% in the original chart and in The Motley Fool’s summary. Benzinga’s corrected list omits him and says an individual had been included in error, without naming that person in its correction note. This article retains his entry solely as an attributed Unusual Whales figure. It does not resolve why the publications differ. Motley Fool summary · Benzinga’s corrected article
The source choice also matters for LaLota: the original chart displays 61.5%, while The Motley Fool lists 61.6%. This table follows the original chart rather than combining values from different summaries.
Source: Original Unusual Whales ranking chart
Show the numbers
| Member | Estimated return |
|---|---|
| Warren Davidson | 78.8% |
| Donald Norcross | 70.8% |
| Terri Sewell | 67.9% |
| Bryan Steil | 62.5% |
| Alex Padilla | 61.7% |
| Nick LaLota | 61.5% |
| Rick Scott | 54.8% |
| Michael Guest | 52.5% |
| Tom McClintock* | 50% |
| Dwight Evans | 41.9% |
| Austin Scott | 39.4% |
| Marcy Kaptur | 36.3% |
| Tracey Mann | 35.4% |
| Stephen Lynch | 34.8% |
| Michael Bennet | 34.4% |
| Eugene Vindman | 34.1% |
| Elissa Slotkin | 33.8% |
| Tom Suozzi | 33.8% |
| Rand Paul | 33.6% |
| Mike Kennedy | 32.7% |
What the estimates measure#
Unusual Whales says it used transaction and annual financial disclosures, estimated share quantities from disclosed value ranges and stock prices, and backtested weighted portfolio returns to the beginning of 2025. Its method mainly concerns stocks and options. The report gives December 29 as its disclosure cutoff. Original report and methodology
A backtest reconstructs historical performance under stated assumptions. It is useful for comparison, but it does not become a broker’s account statement merely because the result is expressed to one decimal place.
The report does not provide this article with independently verified account balances, exact execution prices and a full reconciliation of every household’s cash flows. This article therefore reports the publisher’s estimates and explains their limits. It has not recreated or audited the 20 portfolios.
The cutoff is especially important. A trade made late in the year may be disclosed later. A January publication date does not guarantee that a report contains every December transaction. An amendment can also change what the public record shows.
Returns are different from profits#
Consider two hypothetical accounts, with no deposits or withdrawals. One starts with $10,000 and gains 50%, producing a $5,000 increase. Another starts with $1 million and gains 10%, producing a $100,000 increase. The first wins a return ranking; the second gains more dollars.
Neither example describes a member listed above. They illustrate why multiplying a published return by an unrelated net-worth estimate would not produce a reliable trading-profit figure.
Net worth may include homes, businesses, retirement accounts, liabilities and other assets. A reconstructed stock return applies to the portfolio being modeled, not automatically to every asset a household owns.
A reported transaction amount also is not profit. Selling $100,000 of stock could yield a gain, a loss or little change from the purchase cost. The sale proceeds alone do not answer that question.
| Measure. | What it describes. | What it cannot establish alone. |
|---|---|---|
| Percentage return. | Change relative to invested capital under a method. | Total dollars earned. |
| Trading volume. | Value of purchases and sales. | Net profit or net worth. |
| Realized gain. | Gain on an investment that was sold. | Gains on positions still held. |
| Unrealized gain. | Increase in a holding’s market value. | Cash received from selling it. |
This is why the article ranks estimated percentage returns rather than claiming to identify the 20 members who took home the most money.
A high rank may reflect holdings, not frequent trading#
A portfolio can gain value while its owner makes no new trade. An investor who holds a company through a strong year can finish ahead of someone who buys and sells often. A list of portfolio returns should therefore not be described as a list of the busiest traders.
The Motley Fool’s account of the report makes this distinction. It describes some high-ranking members as holders rather than active traders during 2025. It also warns that congressional-trading datasets differ because of collection and parsing methods. Its discussion of the data
For readers, the practical question is what activity the number credits. Does the model measure holdings carried into the year, purchases made during the year, completed trades or some combination? Two rankings can use different answers and still call their output “performance.”
That is why this article does not mix the original annual snapshot with a current rolling-year leaderboard. A rolling period ending in November 2026 measures a different market window. Combining those figures would produce an incoherent ranking.
The top 20 do not describe all of Congress#
Selecting the leaders creates a strong impression of success. It does not show the typical result among all investors in the same group. To evaluate Congress as a whole, readers need the full population, inclusion rules and performance distribution.
The Motley Fool reports that roughly 100 of 311 disclosed portfolios beat the benchmark in the 2025 analysis. That is a different denominator from the 20 names displayed here. It should not be restated as evidence that every member, or even most modeled portfolios, beat the market.
The top group also cannot establish that one party has a systematic advantage. A party comparison would need all eligible portfolios, comparable treatment of missing records and a clear choice between equal weighting and weighting by dollars.
A small number of large accounts can dominate a dollar-weighted result. Equal weighting answers a different question by giving each account the same influence. Neither method should be selected merely because it produces the more dramatic partisan headline.
The benchmark needs the same dates and definitions#
Unusual Whales displays a 16.8% SPY benchmark in the original chart. That is the reference used by that report. This article does not substitute a separately sourced market number or treat minor differences between summaries as investment skill.
A fair comparison needs matching dates, treatment of dividends and investment exposure. Comparing a partial-year portfolio estimate with a full-year index, or a price-only gain with a reinvested-dividend return, can mislead.
Risk matters as well. A concentrated position can produce a much larger gain or loss than a diversified portfolio. Ranking the largest gains in one year does not establish who took the most prudent risk or who will do best in the next year.
The SEC’s investor guidance describes diversification as a way of spreading investment exposure; it does not guarantee a profit or prevent every loss. That context helps explain why a high single-year return is not the same as a superior long-term investment record. SEC investor guidance on mutual funds
What financial disclosures can reveal#
House rules require covered securities transactions above $1,000 to be reported by the earlier of 30 days after awareness or 45 days after the transaction. Public reports can help readers identify assets, dates, ownership categories and value brackets. House Ethics Committee guidance
Those disclosures do not generally give readers every detail needed to recreate an account. A value bracket can span a wide range. A household report may include transactions attributed to a spouse or dependent child, which should not automatically be described as trades personally ordered by the member.
The SEC’s conditional trading-plan defenses also show why the decision process matters in a legal inquiry. An adviser-managed account and a qualifying advance trading arrangement are not interchangeable labels. The facts and conditions need examination. SEC explanation of trading arrangements
These limits are reasons to be precise about the ranking. They do not make public disclosures useless. The records remain a starting point for checking financial interests and asking informed questions.
A return estimate is not an insider-trading finding#
Insider-trading law concerns material nonpublic information and a breach of the relevant duty, among other requirements. A high return alone does not establish those elements. The SEC also identifies tipping as a possible form of unlawful conduct. SEC explanation
Our review of congressional insider-trading allegations and outcomes examines actual cases and responses. It distinguishes an admitted scheme, inquiries closed without charges and unproven accusations.
None of the 20 entries here is presented as a finding of misconduct. This article has not established that an official used a confidential briefing, passed a tip or traded on information unavailable to the public.
The same standard applies to Warren Davidson, who leads this source’s chart, and to members from every other party. Financial performance and criminal liability require different evidence.
Why the ranking still matters to the reform debate#
Members of Congress help shape policies that can affect investments. Reform supporters argue that a preventive stock rule can address conflicts without requiring a successful criminal case against every troubling transaction.
Senators Ashley Moody$ and Kirsten Gillibrand$ support restrictions on covered ownership and trading by members, spouses and dependent children. Their proposal permits specified exceptions and provides for divestment. Sponsors’ statement
A narrower approach, defended by Senator Pete Ricketts$, would restrict covered purchases and require advance notice of sales. It seeks progress without the same general divestment requirement. Ricketts’s statement
The tradeoff is substantive. Ownership limits remove more company-specific financial interests but require households to transition assets. Purchase limits can constrain activity while leaving existing interests in place. Both approaches need clear definitions and enforcement.
Our polling article on congressional stock restrictions explains public support and the competing proposals. A ranking can inform that debate by making financial interests visible. It cannot settle the policy choice or substitute for proof of wrongdoing.
Reporting and source limits#
This article was reviewed on November 6, 2026. It reproduces the first 20 entries in a named publisher’s displayed year-end snapshot, with ties preserved and source discrepancies disclosed. It does not claim that the underlying estimates have been independently validated or that the chart covers every eligible portfolio.
Unusual Whales campaigns for trading restrictions and sells financial-data services. That interest belongs in the source context. Its advocacy does not automatically invalidate the numbers, but readers should distinguish the backtest from the conclusions the publisher draws.
Secondary coverage was used to compare presentation, not counted as an independent audit of the same underlying data. Original private account records were unavailable. Corrections to the source chart or method could change the ranking.
Our editorial standards require those limits to remain attached to the headline numbers. The most accurate description is an estimated-return snapshot, with a clear source and cutoff.
Photo: U.S. Capitol west front, 1997, Architect of the Capitol; derivative image by O.J., public domain. Original file and provenance. Archival photograph, cropped for publication.

Differing perspectives
How should Congress address investment conflicts highlighted by public trading reports?
Each position is summarized as its supporters make it, with equal weight and in alphabetical order. A summary is not an endorsement; the evidence for each is weighed in the story above.
Advance purchase limits and sale notice
Who holds it: Senator Pete Ricketts
Ricketts argues that Congress should advance restrictions on covered purchases and require advance public notice of sales by members and their families. He presents the House-passed proposal as a step toward stronger public trust. He argues that blocking that measure misses a chance to improve the rules governing financial activity in office.
In their words: Senator Ricketts’s office, September 30, 2026 ↗
Restrict covered ownership and trading
Who holds it: Senators Ashley Moody and Kirsten Gillibrand
The senators argue that members should focus on the nation’s interests rather than personal financial gain from office. Their proposal would limit covered ownership and trading by members, spouses and dependent children, with specified exceptions. They favor divestment to reduce company-specific financial interests alongside public duties.
In their words: Senator Moody’s office, joint statement, January 15, 2026 ↗
Cite this article
567 Politics staff. “Top 20 congressional stock returns: what a 2025 estimate shows—and what it cannot prove.” 567politics. Published 2026-11-06. https://567politics.com/news/top-20-congress-stock-returns-2025-estimates-methodology
Wikipedia citation
{{cite news |title=Top 20 congressional stock returns: what a 2025 estimate shows—and what it cannot prove |url=https://567politics.com/news/top-20-congress-stock-returns-2025-estimates-methodology |work=567politics |author=567 Politics staff |date=2026-11-06 |language=en}}CSL-JSON for reference managers
{
"id": "https://567politics.com/news/top-20-congress-stock-returns-2025-estimates-methodology",
"type": "article-newspaper",
"title": "Top 20 congressional stock returns: what a 2025 estimate shows—and what it cannot prove",
"URL": "https://567politics.com/news/top-20-congress-stock-returns-2025-estimates-methodology",
"container-title": "567politics",
"language": "en",
"author": [
{
"literal": "567 Politics staff"
}
],
"issued": {
"date-parts": [
[
2026,
11,
6
]
]
}
}Citations identify this article and its publication date. Assess the reporting and its linked sources before using it as evidence.
Read this article as Markdown or JSON. Cite the original page and retain its sources, dates and qualifications.
Embed this article summary
Paste this HTML into your page. The summary stays linked to the full story and updates with it. No account required.
<iframe src="https://567politics.com/embed/news/top-20-congress-stock-returns-2025-estimates-methodology?theme=auto" title="Top 20 congressional stock returns: what a 2025 estimate shows—and what it cannot prove by 567politics" width="100%" height="440" style="border:0;max-width:100%" loading="lazy"></iframe> <p style="font-size:14px">Top 20 congressional stock returns: what a 2025 estimate shows—and what it cannot prove by <a href="https://567politics.com/news/top-20-congress-stock-returns-2025-estimates-methodology" rel="nofollow">567politics</a></p> <script async src="https://567politics.com/embed.js"></script>
READ BEYOND 567POLITICS
Alternate sources & perspectives
Independent coverage and primary evidence to help you compare arguments. A link is not an endorsement; perspective labels describe the linked material.
- primary evidence
Original 2025 performance chart ↗
Unusual Whales
The exact displayed chart used for the 20 entries; modeled estimates, not audited returns.
- primary evidence
Report and reconstruction method ↗
Unusual Whales
Explains value-range assumptions and December 29 disclosure cutoff. Provider also advocates restrictions and sells data services.
- independent analysis
Congressional trading overview and returns ↗
The Motley Fool
Secondary coverage of the same dataset, including holdings versus active trading and coverage limits. Not an independent audit.
- independent analysis
Corrected summary of top performers ↗
Benzinga
Carries a correction and omits McClintock; the reason for this difference is unresolved in this review.
- primary evidence
House identities and party affiliations ↗
Clerk of the U.S. House
Official member identity source; not a performance source.
- primary evidence
Senate identities and party affiliations ↗
U.S. Senate
Official senator identity source; not a performance source.
- primary evidence
Transaction disclosure deadlines ↗
House Ethics Committee
Covered reporting thresholds and deadlines help explain disclosure lag.
- other perspective
Broader ownership and trading restrictions ↗
Senator Ashley Moody’s office
Cross-party proposal for covered ownership and trading restrictions.
- right argument
Purchase restrictions and sale notice ↗
Senator Pete Ricketts’s office
Argument for advancing the narrower House-passed approach.
Reviewed 2026-11-06. Ranking transcribed from the original Unusual Whales active-member chart and method read in the browser. This is an attributed estimate, not an independent reconstruction or audit. Disclosure cutoff is December 29, 2025. Compared Motley Fool and Benzinga; both rely on the same underlying provider. Disclosed McClintock’s omission from Benzinga’s corrected list and LaLota rounding differences. Trade-value ranges do not establish exact dollar profits. Private account files unavailable.